Introduction to Debug Mode
VNgen features a built-in debug mode which can be used to view many different types of statistics and easily test different parts of your projects in real-time.
Debug mode is disabled by default, but can be enabled by running the vngen_do_debug command. When enabled, DEBUG MODE will appear in the top-left corner of the display as an indicator that it is now possible to operate the command console.
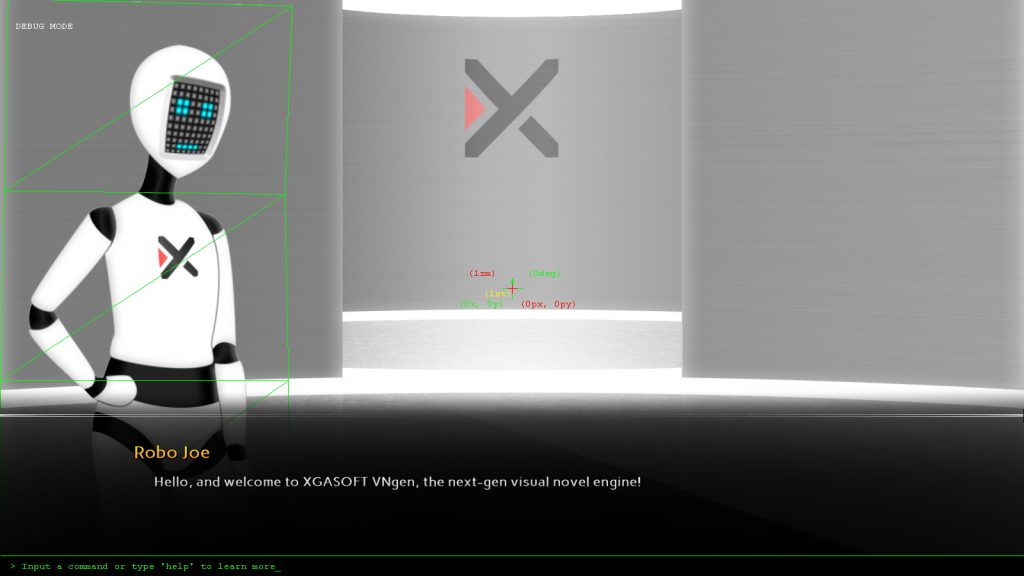
The built-in command console, part of the Quantum framework, is the heart of VNgen's debug functions, and can be opened and closed with the tilde (~) key whenever debug mode is active. As its name implies, the command console allows the user to manually input and execute commands in real-time without setting up custom code and recompiling (as would normally be the case).
For a list of all supported commands, type help in the console and press Enter. This will open a command reference in the default web browser, which you can keep open while continuing to work.
tip
On systems without a compatible browser, entering localhelp will display the same reference directly within VNgen. This version of the reference will be substituted automatically by the regular help command on some platforms.
A recommended command to start with is:
Example#
This will enable drawing a host of stats specific to VNgen, and is the first place you should check to get an idea of what's happening under-the-hood as your script progresses.
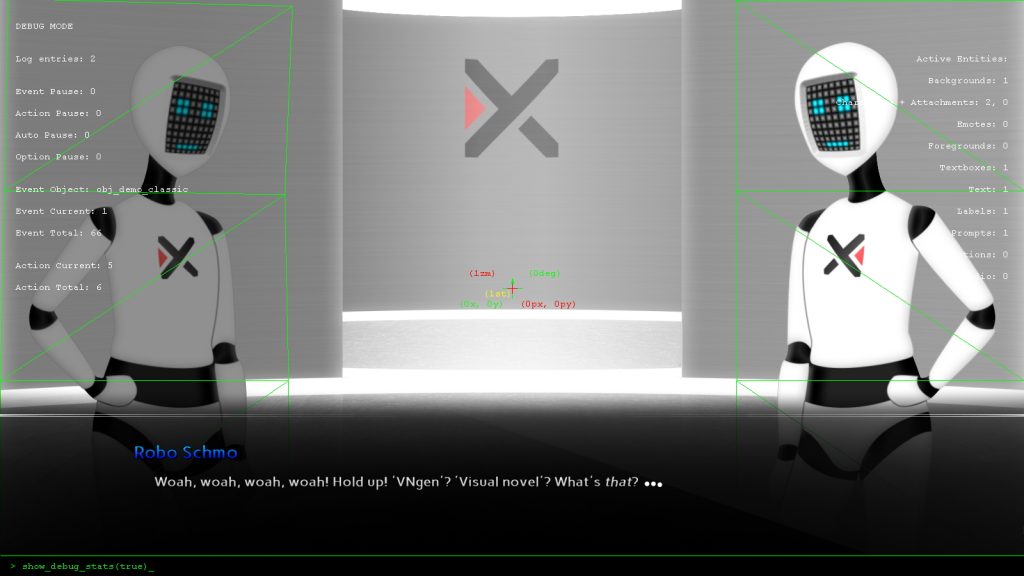
In the column on the left are global stats covering the backlog and the current script object's events and actions. In the right column is a list of active entities, showing how many of each type currently exist.
While this information alone can be incredibly helpful, you might notice a few other visual changes to the scene as well. These colored wireframe indicators are called helpers, and are displayed on the perspective, entities with active deformations, text links, and more. They are enabled by default, but can be disabled with a simple console command:
Example#
Not only does disabling helpers unclutter the scene when you want to get a good look at it, but saves a bit of performance as well.
tip
Tired of entering the same commands over and over? The command console keeps a history of up to 32 recently-entered commands which can be accessed by simply pressing the up and down arrow keys on your keyboard!
In fact, both debug stats and debug helpers will dramatically impact performance when enabled. Normally this isn't a problem, as these tools exist for developer use only, but it's important to note that these features should be disabled before doing any performance testing―which, of course, is also possible through the command console:
Example#
This will enable live performance reports across the top of the screen, providing frames per-second and visual indicators for individual time spent on a number of different tasks.

VNgen is designed from the ground up for optimal performance, so ideally you shouldn’t see each and every indicator visually represented on the debug overlay. If the colored bar on the left only occupies a small portion of the screen, you are experiencing excellent performance. Regardless, it is important to test your projects on as many hardware configurations as possible. On low-end machines, knowing what each color in the performance bar represents is critical:
| Color | Description |
|---|---|
| Green | I/O (keyboard, mouse, or gamepad input, network communications, etc.) |
| Red | Frame update time |
| Yellow | Draw Event processing time |
| Orange | Debug overlay update time |
| White | Time spent waiting for the GPU to finish rendering the current frame |
| Cyan | Text rendering time |
| Gray | Screen clear time |
| Dark Red | GPU clear time |
If any of these colors appears to occupy too large a portion on the debug overlay, it may be time to seek ways to reduce overhead in the particular category it refers to. It’s also important to note the orange portion of the performance bar and disregard factoring it into performance as a whole, since the debug overlay itself consumes a certain amount of resources which will be available in the finished product.